IBH Automatic Fibonacci Retracements for TradeStation®
Automating Fibonacci retracements can be a game changer for traders looking to save time and improve their accuracy in technical analysis. Instead of manually drawing retracement lines, traders can use this tool to automatically plot these lines. With its advanced algorithm, the indicator accurately plots retracement levels based on the trader’s essential trading timeframes:
- Regular trading hours (RTH/pit/day session),
- Extended trading hours (ETH/globex/over-night session),
- Session break,
- Week,
- Month,
- Year,
- Trader-defined, rolling period,
- Trader-defined, arbitrary/ad hoc.
This makes it easier for traders to identify potential support and resistance levels and make informed trading decisions.
If you're interested in automating your Fibonacci retracements and taking your trading to the next level, consider giving our tool a try. With our easy installation process and user-friendly interface, you'll be up and running in no time.
Subscribe
To subscribe, select a free 30 day trial or a $199 lifetime subscription
Documentation
Click here for the product documentation (in .pdf format).
Sample Workspace
Click here to download the IBH AUTOFIB SAMPLE WORKSPACE OCT 2023.TSW file for TradeStation 10.0 Update 70 and higher (newer). If your platform is older than Update 70 then you MAY not be able to load the workspace, but you will be able to create new charts with the indicators provided in your subscription.
The workspace contains several different charts with an auto fib indicator inserted into each chart. Start with this workspace to produce your first auto fib chart. When you open the sample workspace you will see the following windows:
The workspace contains several different charts with an auto fib indicator inserted into each chart. Start with this workspace to produce your first auto fib chart. When you open the sample workspace you will see the following windows:
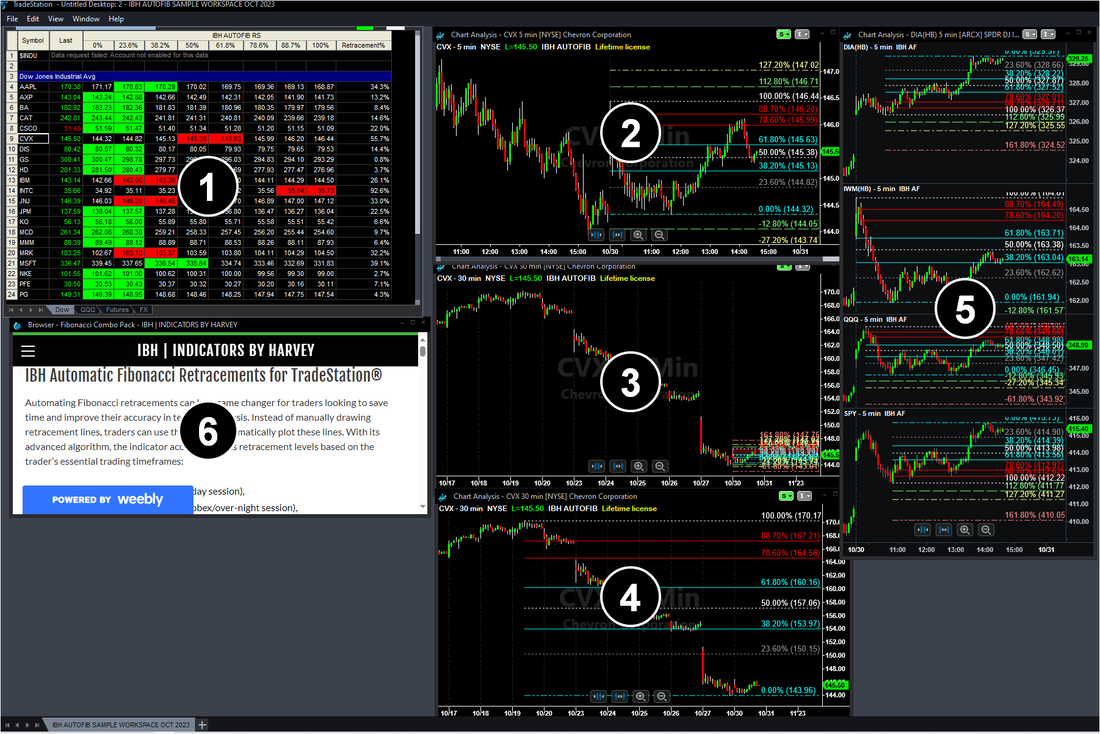
RadarScreen 1 - if you want to monitor intraday fib ranges for a number of symbols...
The radarscreen contains IBH FIBS RS placed on several different tabs to provide a clear visual of price's location within the current day's trading range. Update value intra-bar is enabled for extreme visual accuracy.
Chart 2 - Intraday auto fibs...
Contains IBH AUTOFIB with the Range: Type input name set to "S". This produces an autofib for the most recent session for the symbol. This chart is symbol linked with the radarscreen.
Chart 3 - Weekly...
Contains IBH AUTOFIB with the Range: Type input name set to "W". This produces an autofib for the current week. This chart is symbol linked with the radarscreen.
Chart 4 - Monthly...
Contains IBH AUTOFIB with the Range: Type input name set to "M". This produces an autofib for the current month. This chart is symbol linked with the radarscreen.
Chart 5 - Intraday view of 4 major market ETFs...
Contains IBH AUTOFIB with the Range: Type input name set to "S". This produces an autofib for the current session. Multiple symbols in the 78.6-88.7% reversal range can signify a potential reversal on balancing days.
Browser Window 6
Gets you here...
Usage Ideas
The following is a brief OLD video that contains some usage ideas when trading SPY or ES (or similar) products:
Fibonacci retracements that align across multiple timeframes may be signals for trade entry/exit. Take a look at the SPY ETF on July 7, 2015:


- Using the Arbitrary timeframe auto-fib indicator, set the start date/time to the beginning of 2015, to see that the daily low was a 61.8% retrace (magenta ellipse) of the 2015 price range
- Using the Monthly auto-fib, the daily low on the SPY was a 112.8% extension (magenta ellipse) of the previous month's range
- Using the RTH auto-fib, the intra-day low was a 161.8% extension (magenta ellipse) of the previous day's range
Larger Timeframe Fibonacci retracements that align across multiple products may be trade signals. Take a look at the SPY, DIA, IWM, and QQQ ETFs during the week of August 31, 2015:
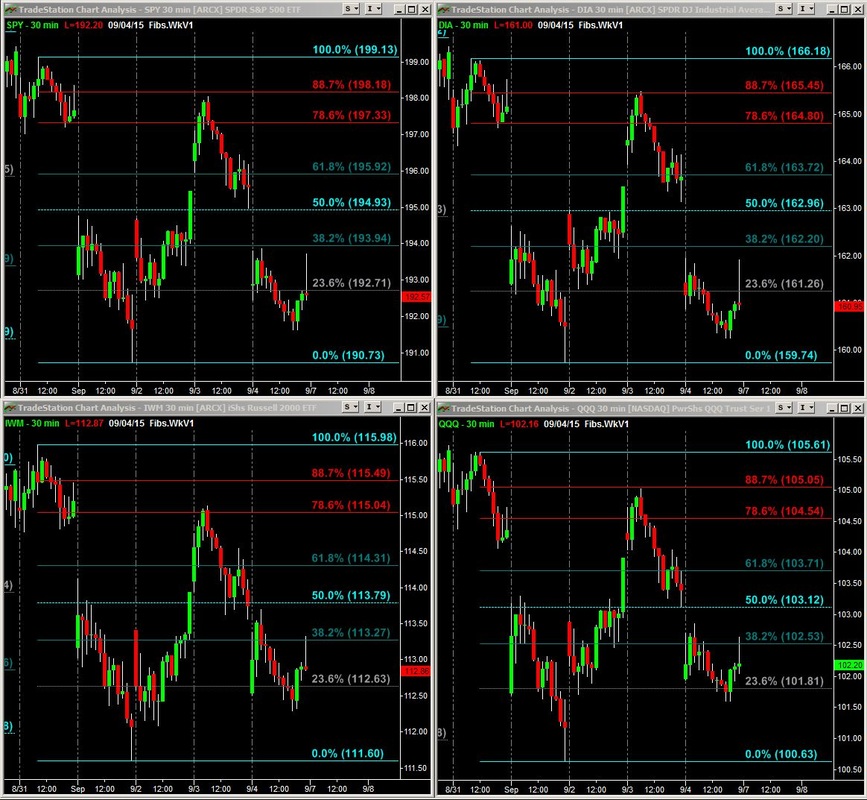
- Using the monthly time frame auto-fib indicator, notice that the SPY, DIA, IWM, and QQQ ETFs all reversed into the 78.6-88.7% reversal zone of the weekly range on the same 30 minute candle
Fibonacci extensions or retracements of the previous ETH session may serve as targets or reversals in the current RTH session. Take a look at the ES futures contract on March 22, 2016:
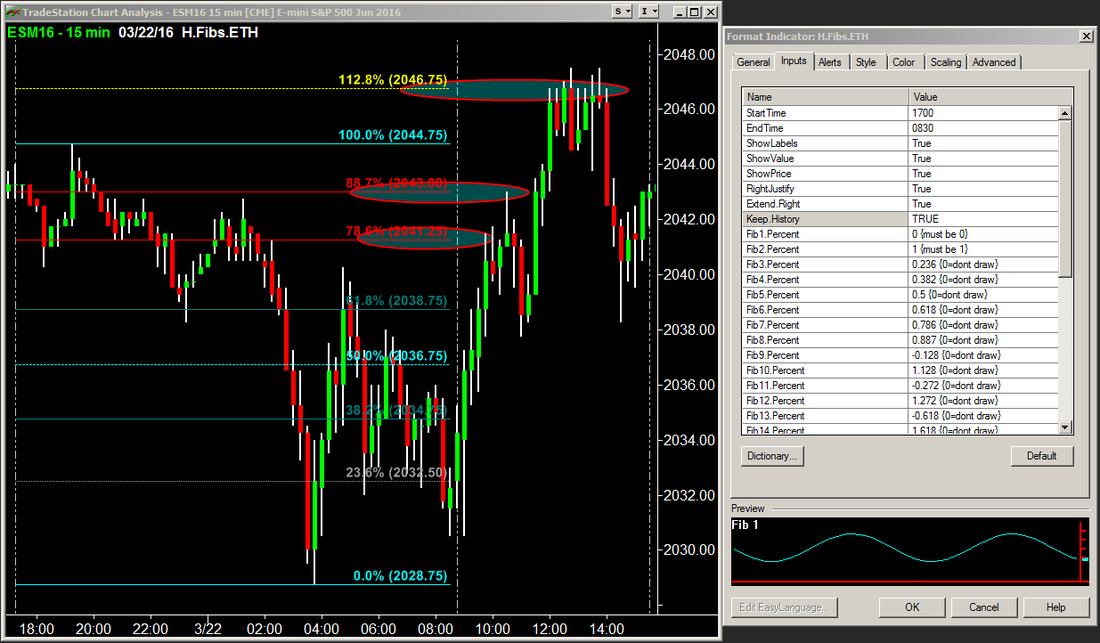
- Using the ETH time frame auto-fib indicator, notice how the 78.6%, 88.7% and 112.8% retracements of the ETH range during the RTH session influenced the price action
While these situations, by themselves, are not a sufficient reason for the market to turn, reviewing market internals or other metrics may suggest a low risk, high probability trade.
If you are comfortable with Twitter click here to see my most recent #AutoFib tweets.
If you are comfortable with Twitter click here to see my most recent #AutoFib tweets.
