IBH Cumulative Tick for TradeStation®
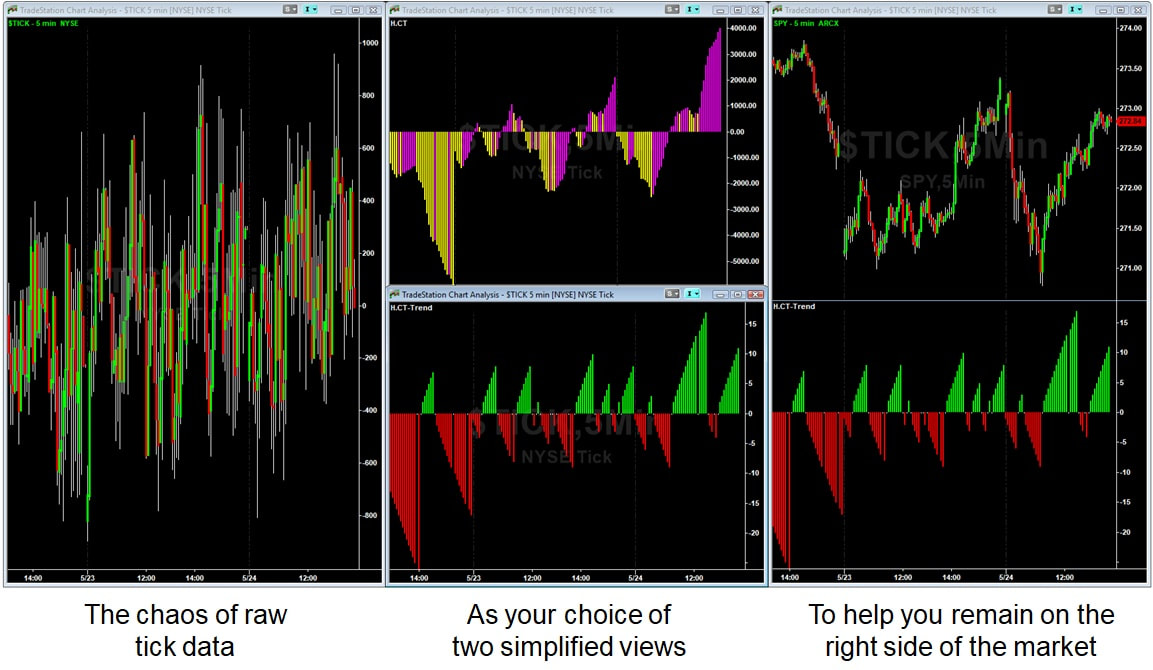
Credit goes to the folks at ShadowTrader for developing the idea of cumulative tick. This indicator maintains a running total of cumulative tick during the trading day, or trader defined start date/time, and charts it.
- Adds insight into tick divergences and confirmations
- Exposes the overall trend of underlying buying and selling on the day to reinforce direction and avoid "shake outs"
- Supports the cumulative ticks of NYSE, Nasdaq, S&P 500, Nasdaq 100, DJIA, and Russell 2000 indices
Subscribe
To subscribe, select a free 30 day trial or a $179 lifetime subscription.
Documentation
The indicator documentation is comprised of a single document only available here:
- The user guide (in .pdf format)
- $TIKA - AMEX Tick ($TIKAC - AMEX Tick Composite)
- $TICK - NYSE Tick ($TICKC - NYSE Tick Composite)
- $TIKQ - NASDAQ Tick
- $TIKND - NASDAQ 100 Tick
- $TIKI - DOW 30 Tick ($TIKIC - DOW 30 Tick Composite)
- $TIKR - ARCX Tick ($TIKRC - ARCX Tick Composite)
- $TIKSP - S&P 500 Tick ($TIKSPC - S&P 500 Tick Composite)
- $TIKRL - Russell 2000 Tick ($TIKRLC - Russell 2000 Tick Composite)
- $TIKUS - All US Tick ($TIKUSC - All US Tick Composite)
- $TIKUSL- All Amex, NASDAQ and NYSE Tick ($TIKUSLC - All Amex, NASDAQ and NYSE Tick Composite)
Sample Workspace
Click here to download the IBH CUMULATIVE TICK SAMPLE WORKSPACE OCT 2023.TSW workspace file for TradeStation 10.0 Update 70 and higher (newer). If your platform is older than Update 70 then you may not be able to load the workspace, but you will be able to create new charts with the indicators provided in your subscription.
The workspace contains several different charts with a cumulative tick indicator inserted into each chart. Start with this workspace to produce your cumulative tick chart. When you open the sample workspace you will see the following nine windows:
The workspace contains several different charts with a cumulative tick indicator inserted into each chart. Start with this workspace to produce your cumulative tick chart. When you open the sample workspace you will see the following nine windows:
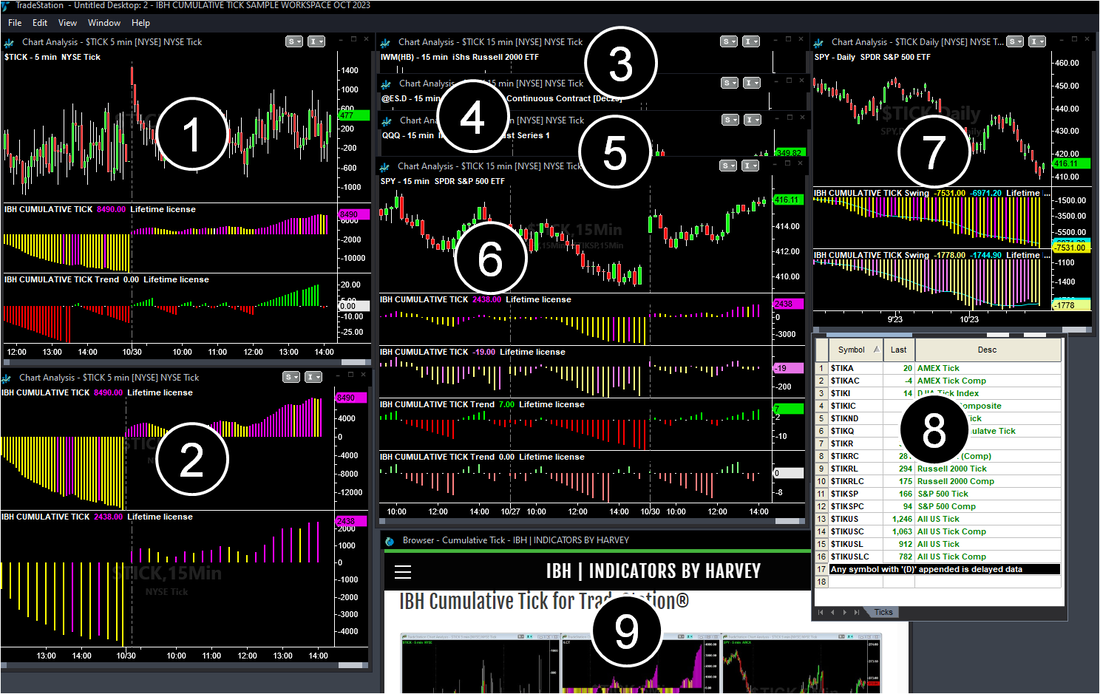
Chart 1 - Visualize CT versus CT trend
$TICK, 5 minute interval on sub-graph 1. IBH CUMULATIVE TICK and IBH CUMULATIVE TICK Trend indicators inserted in separate sub-graphs. The drawback of this chart is that the value of $TICK remains visible and may influence the trader's confidence or intention of remaining in or entering into a trade.
Chart 2 - Multiple Time Frame
The symbol $TICK is inserted twice:
The first instance is a 5 minute chart interval, price data is invisible, scaling axis is set to no axis and is "displayed" on sub-graph 1.
The second instance of $TICK is a 15 minute chart interval, price data is invisible, scaling axis is set to no axis and is "displayed" on sub-graph 2.
The IBH CUMULATIVE TICK indicator is inserted twice:
The first instance is based on $TICK 5 min, scaled on right axis of sub-graph 1. The second instance is based on $TICK 15 min, scaled on right axis of sub-graph 2.
This chart provides a quick comparison of 5 and 15 minute cumulative tick. Generally, trading is "easiest" when the 5 and 15 minute shapes of cumulative tick are similar. .
Charts 3 through 6 - Your Primary Cumulative Tick Charts to Trade SPY, QQQ, @ES.D, IWM
This chart builds on the idea of the previous chart. It contains the symbols $TICK ad the most appropriate tick symbol for the charted Symbol. $TICK and other tick symbol are hidden from display.
The IBH CUMULATIVE TICK indicator is inserted twice:
The first instance is based on $TICK, scaled on right axis of sub-graph 2
The second instance is based on "the other tick symbol", scaled on right axis of sub-graph 3; additionally the colors were changed to provide a visual reminder that the indicator is using a different symbol
The IBH CUMULATIVE TICK Trend indicator is inserted twice:
The first instance is based on $TICK, scaled on right axis of sub-graph 4
The second instance is based on "the other tick symbol", scaled on right axis of sub-graph 5; additionally the colors were changed to provide a visual reminder that the indicator is using a different symbol
For SPY, the chart contains $TICK & $TIKSP
For QQQ, the chart contains $TICK & $TIKQ
For @ES.D, the chart contains $TICK & $TIKSP
For IWM the chart contains $TICK & $TIKRL
Chart 7 - Swing Cumulative Tick
The indicator IBH CUMULATIVE TICK Swing was added in version 2 to provide a swing trader view of cumulative tick. This chart contains the same symbols as that described in the 15 minute SPY chart (on sub-graph 1). The difference is the indicators inserted.
The IBH CUMULATIVE TICK Swing indicator is inserted twice:
The first instance is based on $TICK, scaled on right axis of sub-graph 2
The second instance is based on $TIKSP, scaled on right axis of sub-graph 3; additionally the colors were changed to provide a visual reminder that the indicator is using a different symbol
This chart allows the trader for focus on the swing price action of $SPY with the cumulative tick of the broad market ($TICK) and the cumulative tick of the S&P500 ($TIKSP).
The swing cumulative tick was configured to begin on January 1, 2023 to provide an insight into cumulative tick since the year began.
RadarScreen 8 - Different "Tick" Symbols
If any of the symbols in this radarscreen are appended with the characters (D) then you do not have real time access to this symbol. As a result, if this symbol is contained in any of the charts in this workspace then you will see a "You may not mix symbols with different delays in the same window" message displayed on that chart. You do not need to change your data subscription to use this indicator unless you want the specific chart/symbol that is delayed.
Browser Window 9
Gets you here...
